Siting the Grid: A Geospatial Case for Smarter Data Center Location in Washington State
Simon-Hans Edasi / Edasi Mõtlev LLC / June 2026
Washington's data center industry has clustered in Grant County and the Columbia Basin
for one reason: cheap hydropower and proximity to high-voltage transmission lines.
That single-variable optimization is now colliding with water scarcity, community
opposition, and grid saturation. This analysis quantifies what a more defensible
siting decision looks like.
Composite Siting Suitability Explorer
Each cell is a 0.15-degree grid square (~14 km) scored on five normalized indicators.
Adjust the weights below to see how priorities change the siting landscape.
Existing and proposed data center locations are shown as markers.
Indicator weights — drag to adjust, scores auto-normalize
Transmission proximity (grid access)
40%
Water availability (annual precip)
35%
Community burden (EJScreen index, inverted)
25%
Seismic safety (inverse PGA)
0%
Flood safety (outside FEMA SFHA)
0%
Contamination (distance from EPA TRI facility)
0%
Waterway safety (distance from major river)
0%
Geothermal opportunity (IHFC 2024 heat flow)
0%
Terrain flatness (SRTM 90m slope; hard gate at <3% flat)
0%
Population exposure (residents per km², inverted)
0%
Aquifer depth (USGS NWIS depth-to-water; deep = lower risk)
0%
Soil drainage (SSURGO hydrologic group; D = low permeability)
0%
Score 0–1 • green = more suitable •
red = less suitable •
cyan circle = recommended zone (≥0.75) •
white diamond = existing DC •
outline diamond = proposed DC •
■ terrain gate •
■ protected land gate
Key Findings
1
The Quincy corridor is grid-optimal but water-constrained
Grant County's existing cluster scores near-perfect on transmission proximity
(tx_score > 0.98) but 0.19 on water availability — semi-arid at ~640 mm/yr.
The Columbia Basin's water allocation is effectively fully subscribed.
Grant County PUD's own administrator has stated that water and power
are "maxed out."
2
A 30% better composite score exists 50–80 km west
The Digital Realty proposed site in the Cascade foothills scores 0.783 vs. 0.599
for the Quincy cluster — same grid access class, but annual precipitation of
1,441 mm/yr vs. 640 mm/yr. The gap closes when seismic risk is added (Puget Sound
basin PGAM is 3–5x eastern WA), pointing to the Kittitas/Ellensburg corridor
as the practical sweet spot.
3
Seismic risk partially explains the eastern WA cluster
The Puget Sound region has PGAM values of 0.5–1.0g due to Cascadia subduction
zone amplification and the Seattle Fault — 3–5x higher than the Columbia Basin.
Higher seismic hazard means higher structural cost, higher insurance, and higher
business continuity risk. This partly justifies the industry's eastward preference
independent of water.
(USGS 2018 NSHM)
4
25 projects canceled nationally in 2025 — water cited in >40%
Canceled WA projects (Grant County expansions, Yakima Basin proposals) score
high on grid access but below 0.20 on water availability — consistent with their
documented failure reason. A pre-siting screen on the three indicators in this
model would have flagged every WA case as water-constrained before permitting.
(Heatmap News, 2025)
5
Three major proposed campuses are clustering in the driest cells in the state
The Tri-Cities / southeast Columbia Basin is emerging as the next data center frontier — and
every proposed site there scores water = 0.000, the floor of this analysis (~150–220 mm/yr).
Amazon's $4.8B Wallula Gap campus (554 acres, Burbank, approved February 2026),
Atlas Agro's $500M Richland DC1 (275 acres at Horn Rapids Road, approved December 2025), and
Trammell Crow's Lewis & Clark Ranch campus (up to 1,000 acres, West Richland, in due diligence)
all fall in the same water-floor band. Composite scores range 0.506–0.583 — below Quincy.
The industry is moving deeper into arid eastern WA at exactly the moment the state is legislating
mandatory water-use reporting.
(DCD,
Tri-Cities Journal,
NBC Right Now)
Scores by cluster
Scores reflect the ~14 km grid cell containing each cluster. Composite updates live with the weight sliders above.
Cluster
Grid access
Water
Community
Seismic
Contamination
Waterway
Geothermal
Flatness
Composite
Quincy (Grant County)
0.988
0.189
0.552
0.885
0.501
0.068
0.319
0.769
0.563
Malaga / East Wenatchee
0.985
0.293
0.636
0.848
0.554
0.244
0.318
0.479
0.610
Seattle downtown
0.968
0.743
0.544
0.371
0.009
0.463
0.257
0.705
0.544
Tukwila corridor
0.994
0.739
0.109
0.402
0.028
0.544
0.235
0.828
0.506
Liberty Lake (Spokane)
0.996
0.244
0.877
1.000
0.145
0.116
0.461
0.564
0.605
Digital Realty (proposed)
0.968
0.743
0.544
0.371
0.009
0.463
0.257
0.705
0.544
Wallula Gap / Burbank (proposed)
0.987
0.000
0.446
0.916
0.014
0.015
0.339
1.000
0.465
Richland / Horn Rapids (proposed)
0.996
0.000
0.737
0.913
0.142
0.046
0.342
1.000
0.522
West Richland / Lewis Clark Ranch (proposed)
0.930
0.000
0.737
0.918
0.207
0.037
0.560
0.833
0.549
Note: Tukwila's community burden score (0.109) reflects Census ACS high poverty/minority rates in the
SR-99 industrial corridor. Grid access and water are strong, but EJ burden is the highest of any
active cluster in this analysis.
Top 10 Unclaimed Site Scores
Grid cells with no existing or proposed data center, ranked by composite score under the current
weight settings. Locations are cell centroids (~14 km resolution). Updates live with the sliders above.
Location
Grid access
Water
Community
Seismic
Geothermal
Flatness
Aquifer
Soil
Composite
Loading…
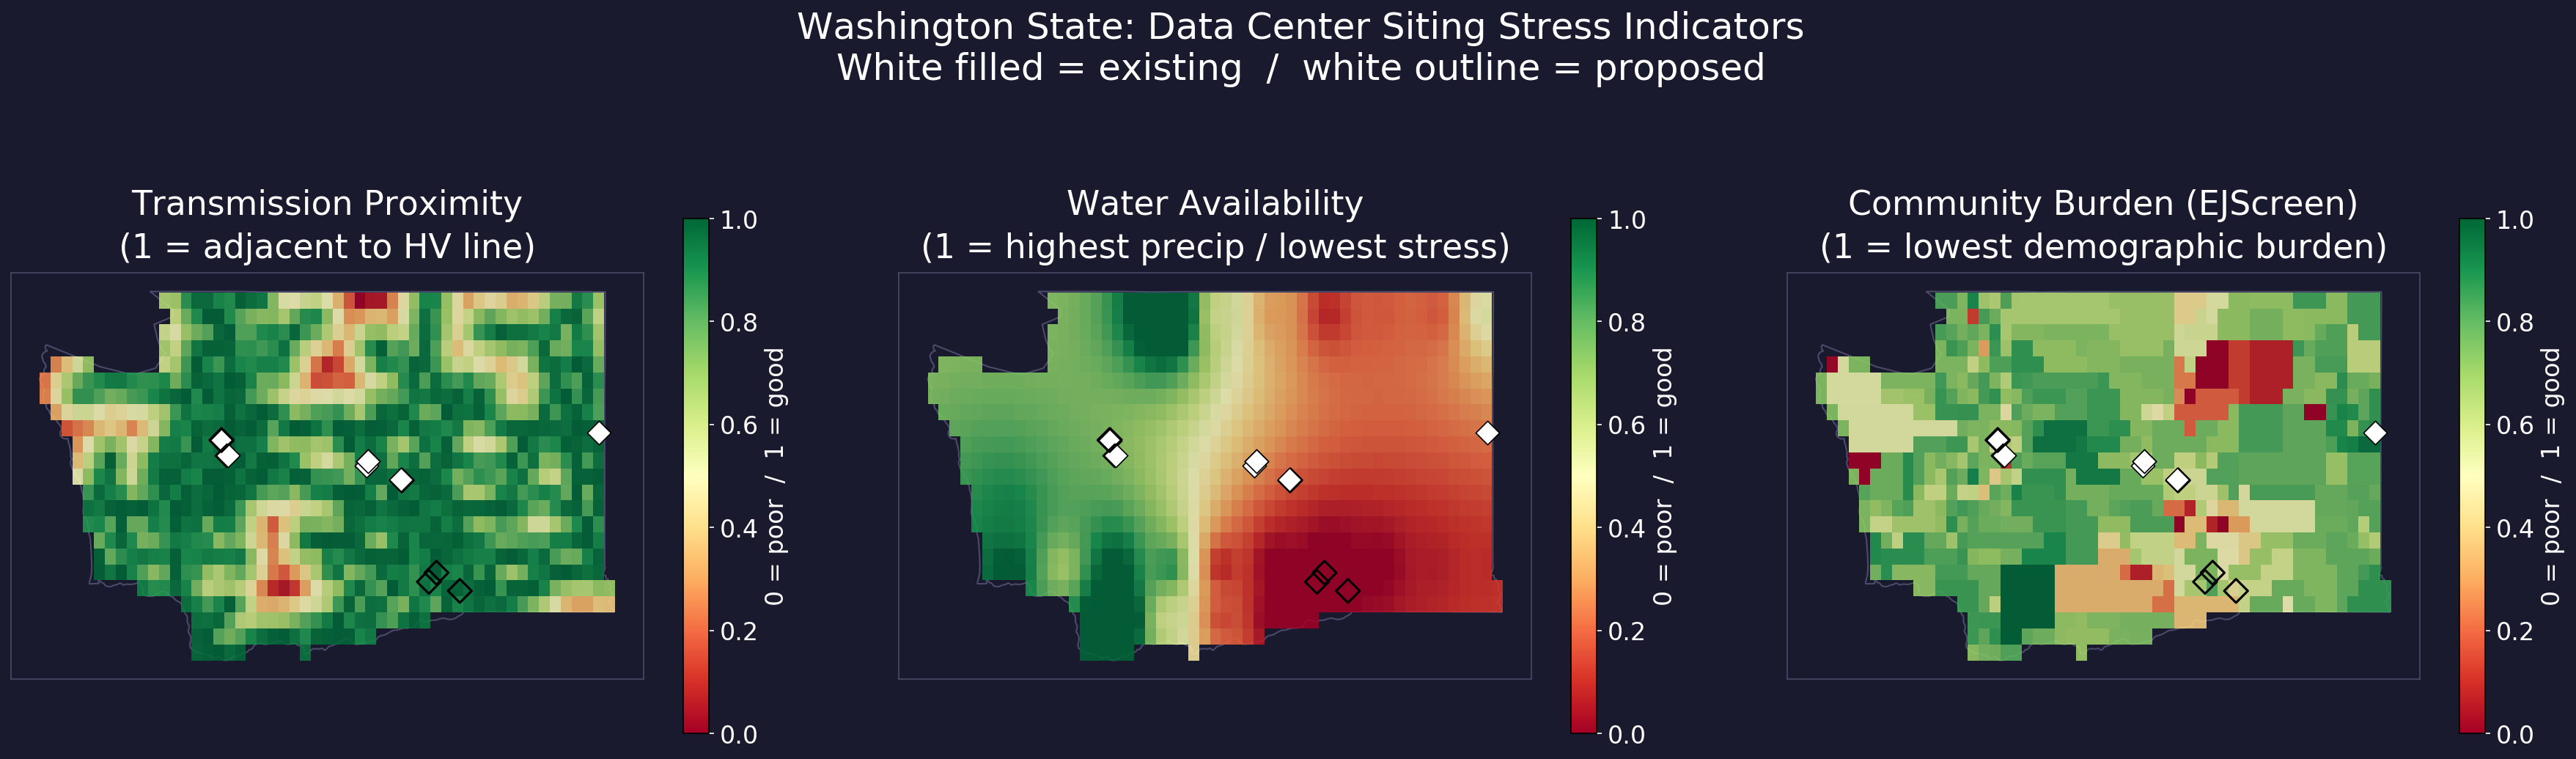
Individual Indicator Maps
Each indicator normalized 0–1 (green = favorable for siting).
White diamonds mark existing and proposed data center locations.
Left to right: transmission proximity, water availability (annual precip), community burden (Census ACS Demographic Index, inverted).
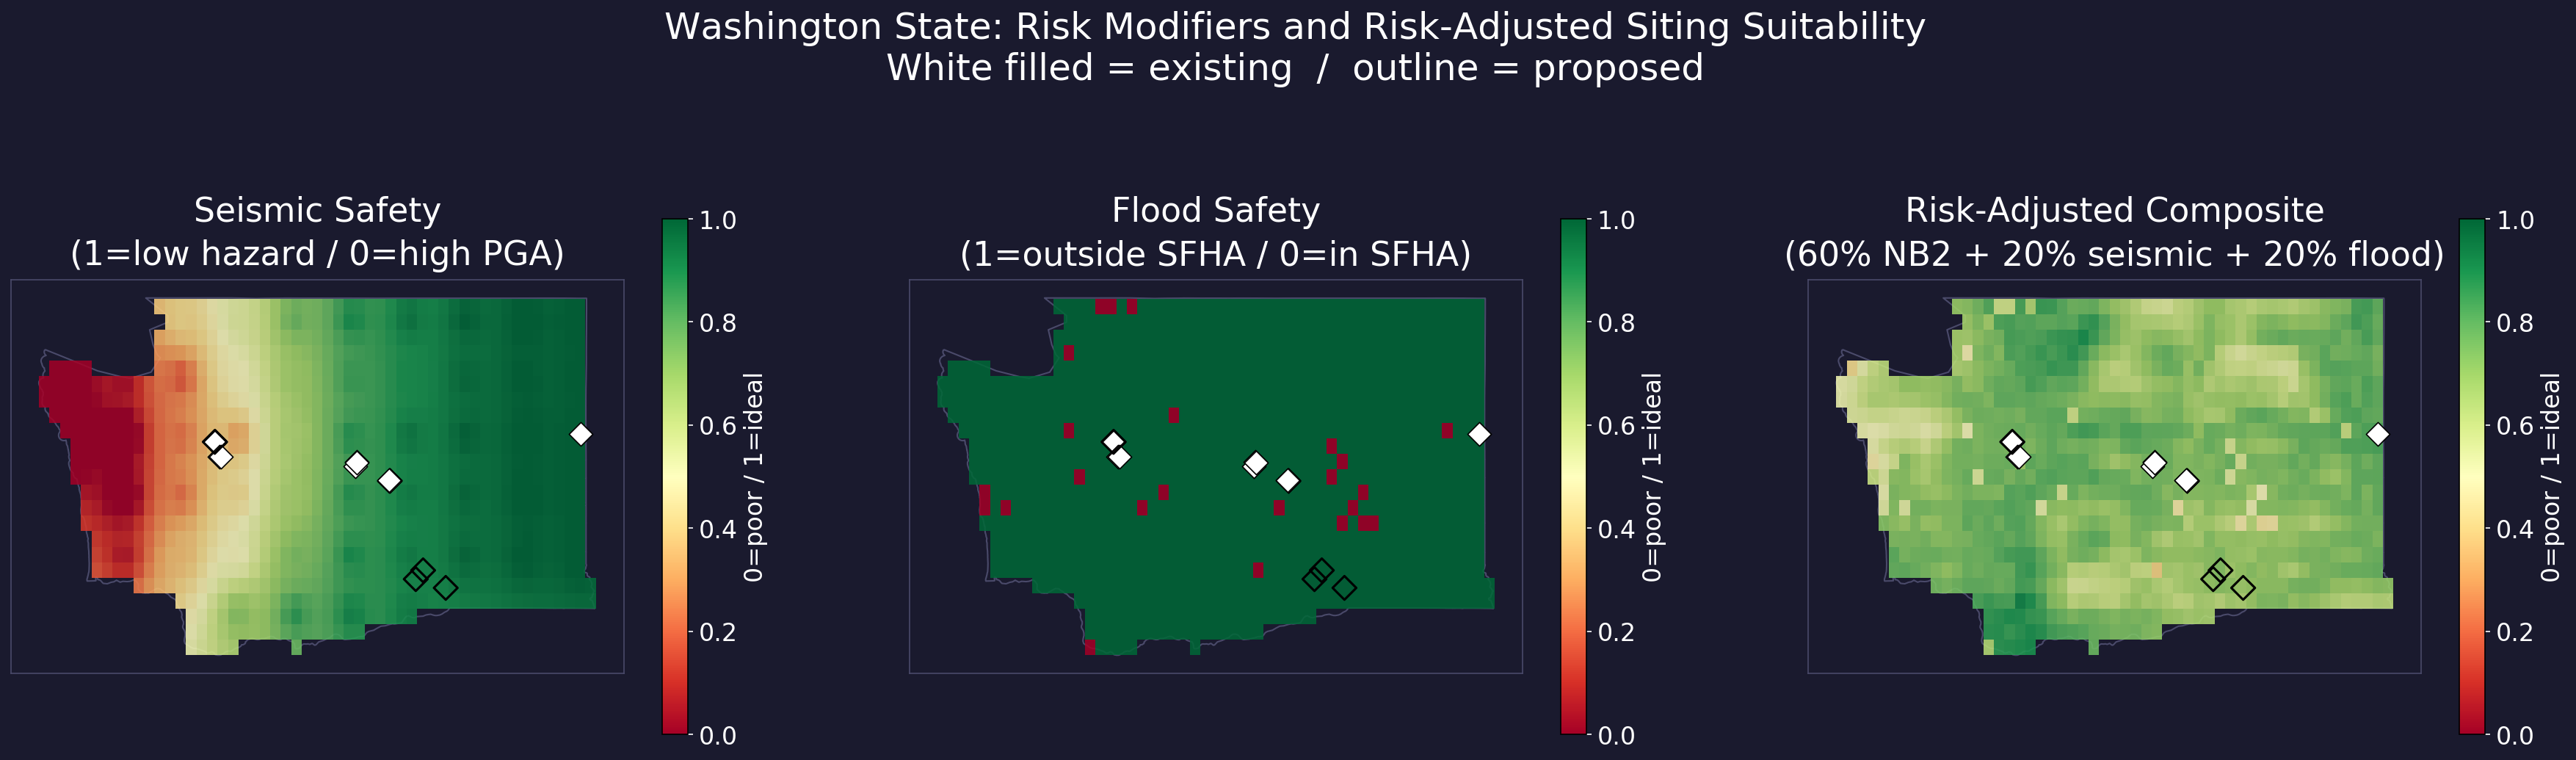
Risk modifiers: seismic hazard and flood zones
Adding USGS National Seismic Hazard Model PGA values and FEMA flood zone designations
as risk disqualifiers shifts the picture: the Puget Sound basin drops sharply on
seismic score, and river corridor cells flag on flood risk.
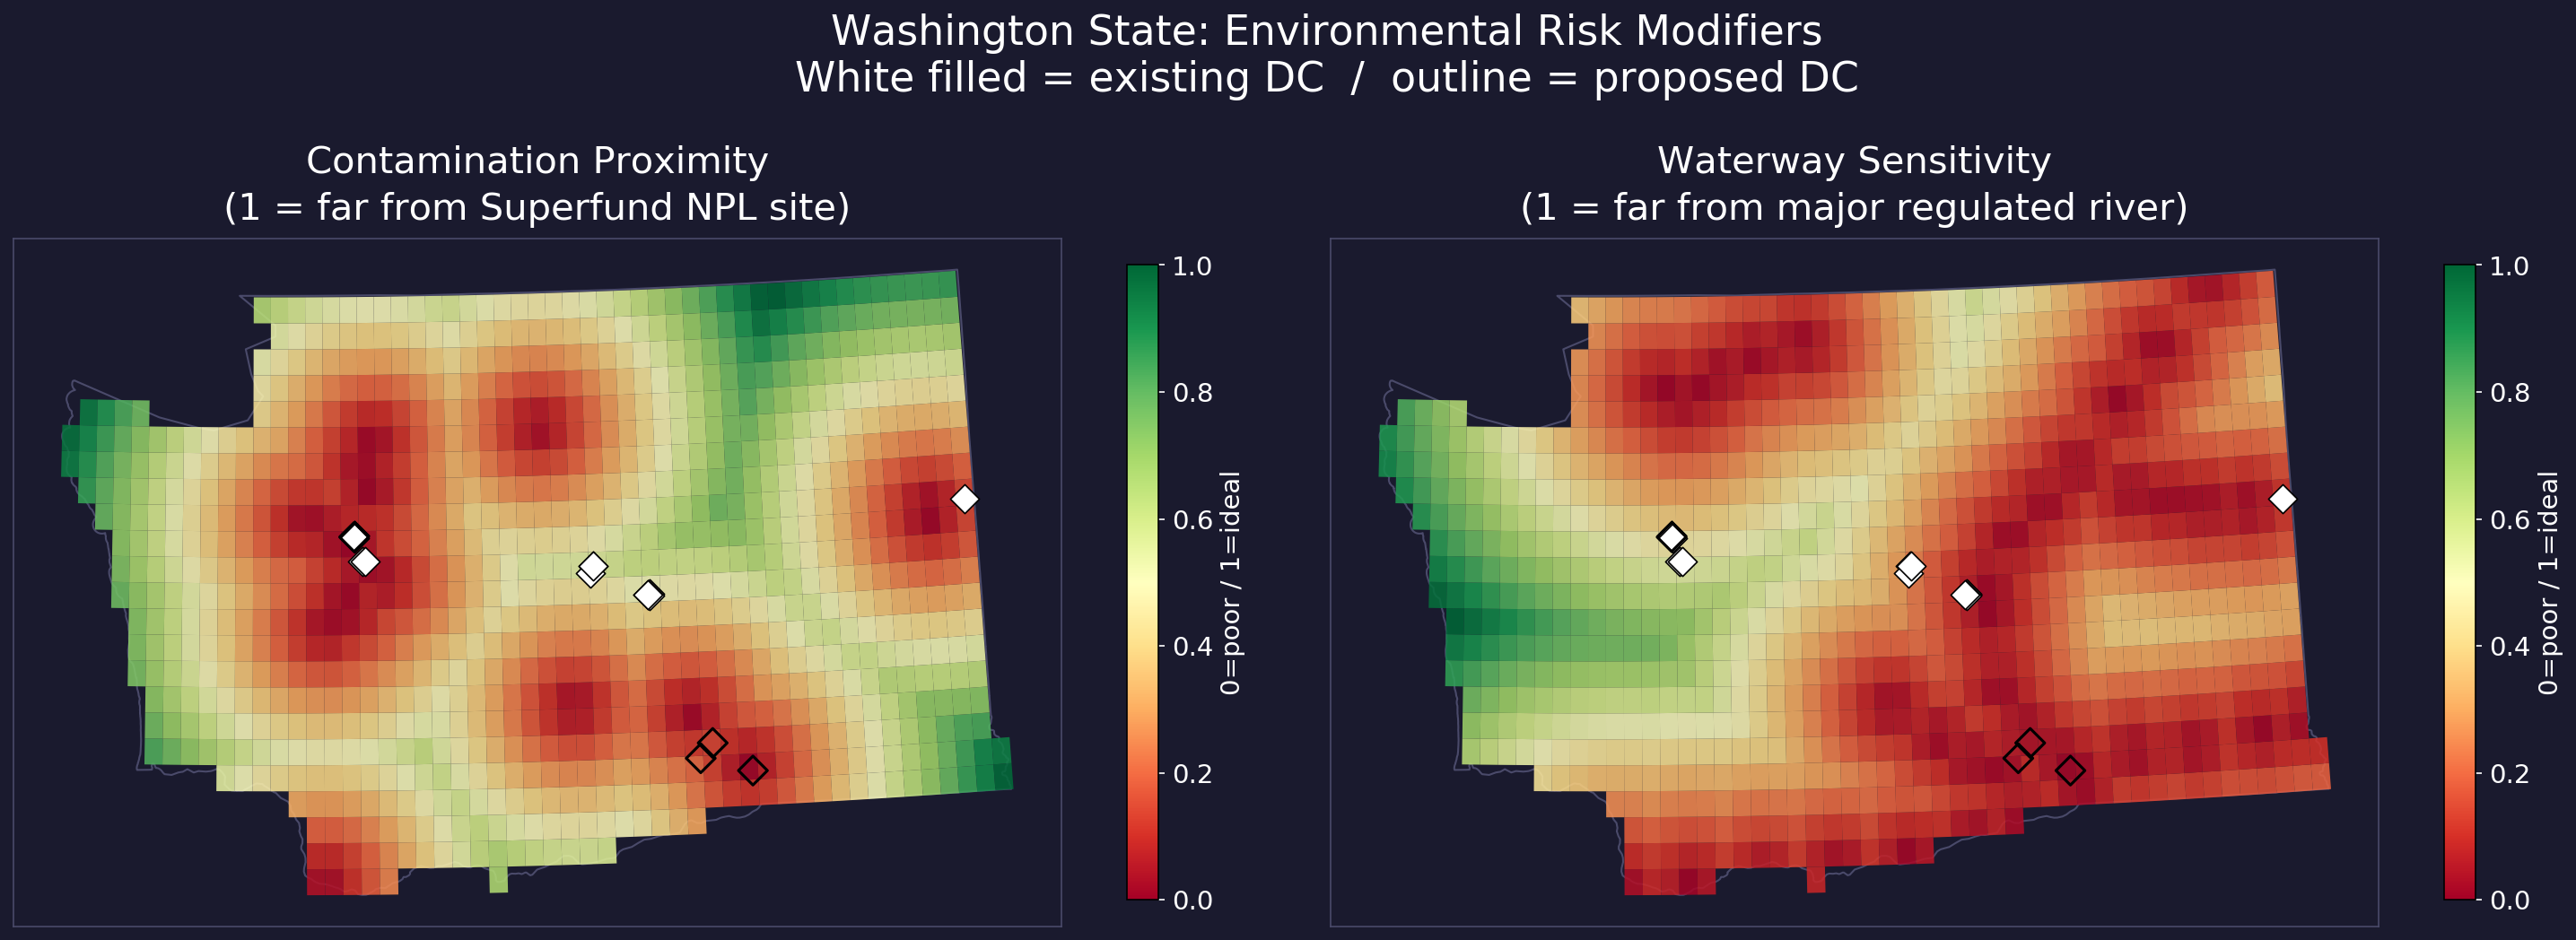
Environmental Risk: Contamination and Waterway Sensitivity
Two additional risk modifiers quantify environmental liability independent of water scarcity.
Contamination proximity scores each cell by distance to the nearest facility
in the EPA Toxics Release Inventory (TRI) — 556 geocoded WA industrial sites reporting
toxic chemical releases. Amazon's Wallula Gap campus scores 0.014, placing it immediately
adjacent to one of the most industrially concentrated corridors in eastern Washington.
Waterway sensitivity scores by distance to the nearest major regulated
river (Columbia, Snake, Spokane, Skagit, Yakima) — a proxy for ESA Section 7 thermal
discharge constraints and water withdrawal scrutiny. The same Wallula Gap site scores
0.015, placing it directly on the Columbia's bank.
Left: contamination proximity (1 = far from EPA NPL Superfund site). Right: waterway sensitivity (1 = far from major regulated river). White filled = existing DC; outline = proposed.
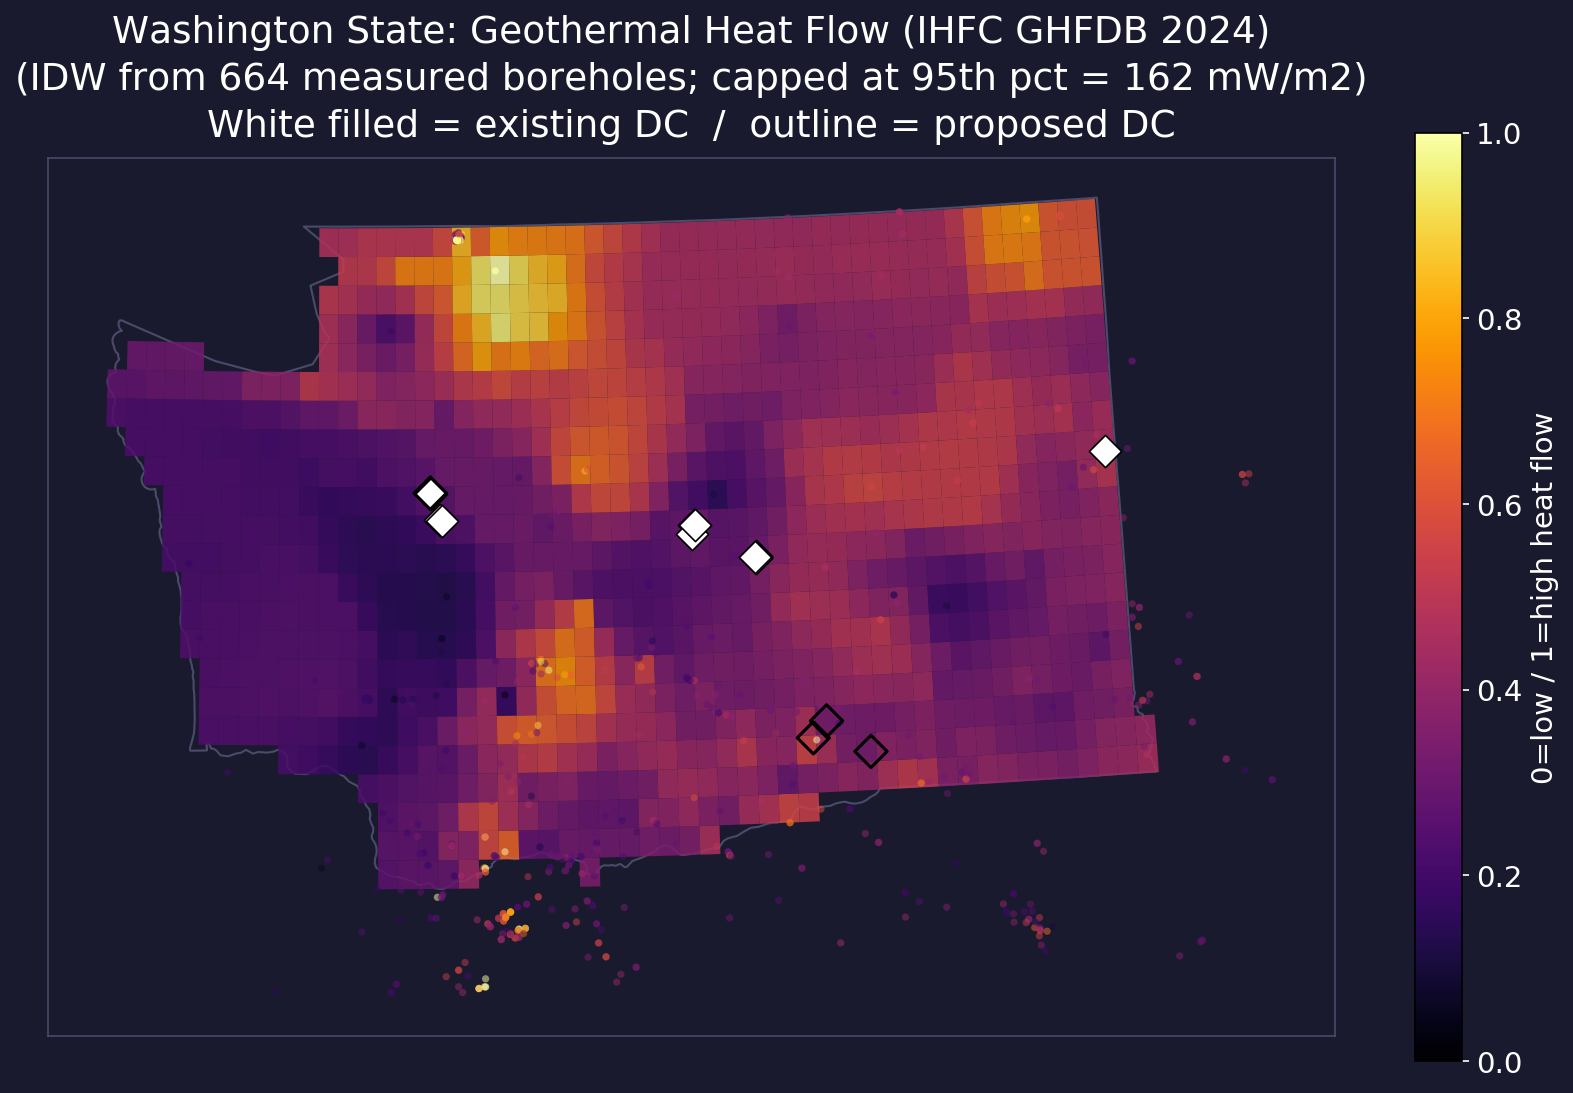
Geothermal Resource Opportunity
Surface heat flow (mW/m²) from the
IHFC Global Heat Flow Database 2024
(664 measured borehole sites within the Washington State bounding box)
is IDW-interpolated to each grid cell and normalized 0–1.
Higher scores indicate elevated geothermal energy potential, primarily following the
Cascade volcanic arc. Values are capped at the 95th percentile (162 mW/m²) to
prevent hydrothermal anomalies near Mount Baker (up to 5,146 mW/m²) from
dominating the spatial interpolation.
In the composite scoring, geothermal opportunity functions as an
opportunity indicator: cells adjacent to elevated heat flow can in principle
tap enhanced geothermal or direct-use systems to offset grid power demand.
The Cascade foothills score highest; the eastern Columbia Basin, where most
existing and proposed campuses are located, scores 0.30–0.35.
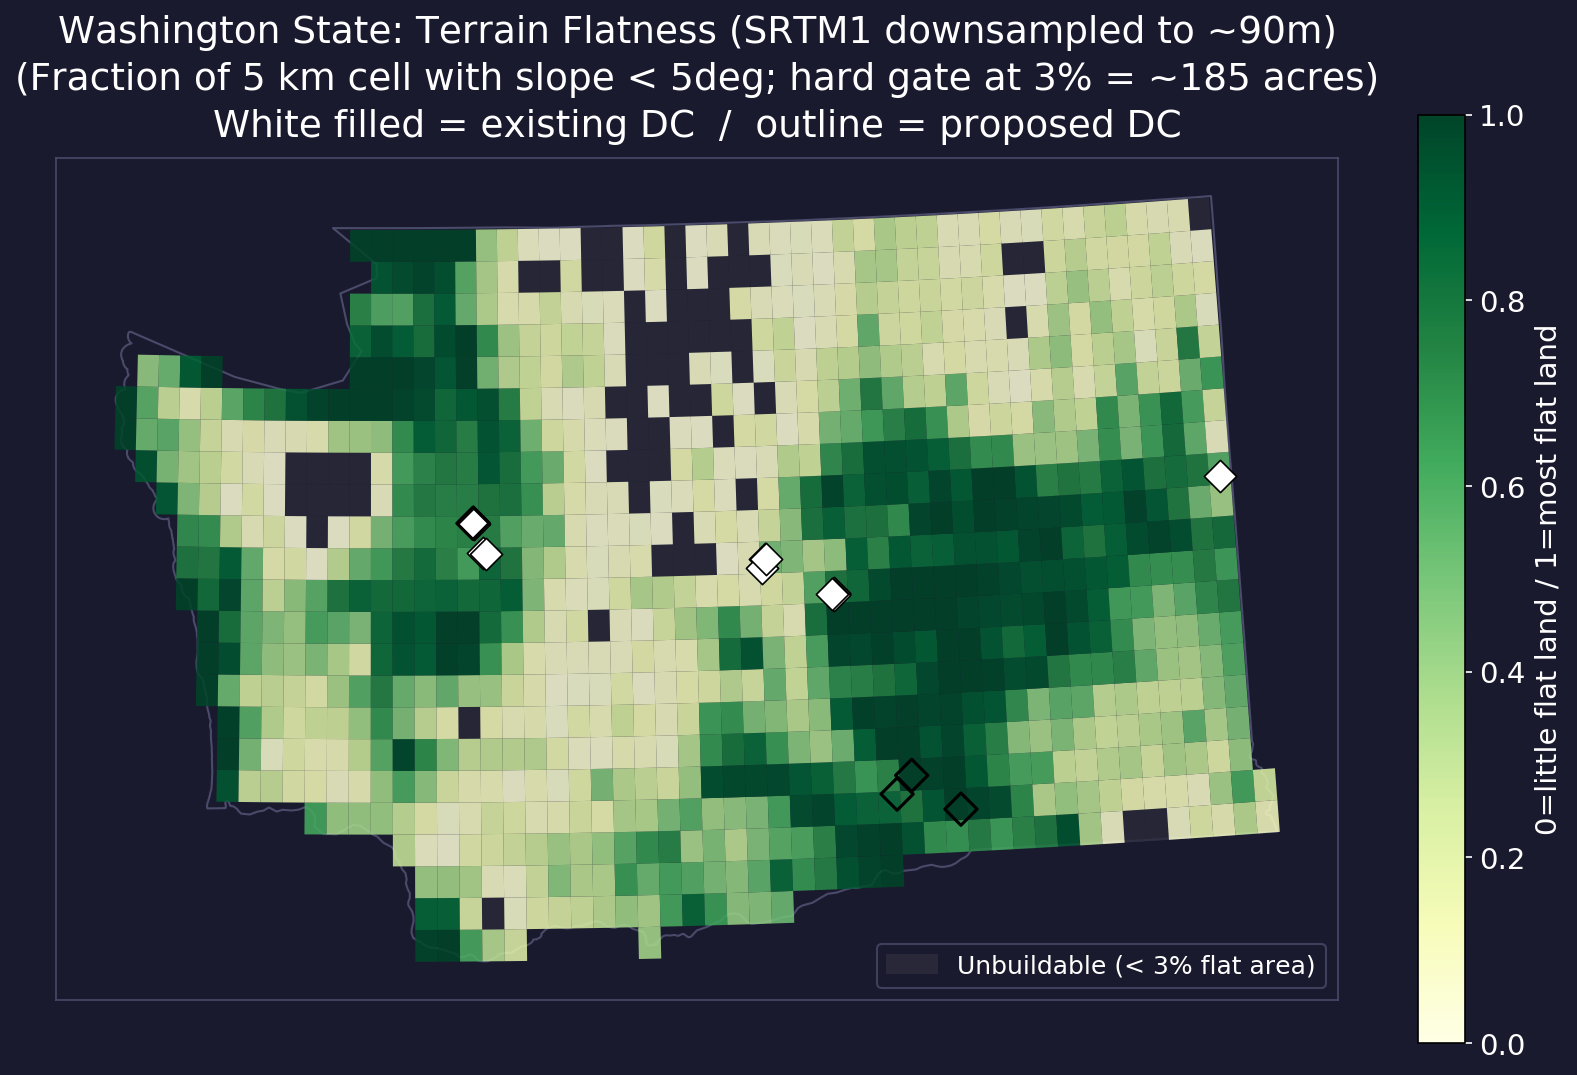
Large data center campuses require 20–30 acres of essentially flat ground for foundations,
cooling infrastructure, and security setbacks. This indicator asks not whether a grid cell is
uniformly flat, but whether enough flat land exists within it to accommodate a campus pad.
Slope is computed at ~90m resolution from
SRTM1 tiles
(AWS Open Data terrain tiles bucket) using numpy.gradient with a per-latitude
correction for east–west pixel width. For each 5 km grid cell, the score is the
fraction of pixels with slope < 5° — the conventional threshold for
large-pad civil grading.
Cells where fewer than 3% of pixels meet this threshold (< 185 acres of sub-5° terrain)
are hard-gated as unbuildable and rendered as dark overlays on the map regardless
of slider weights. 61 cells (6.3% of the analysis grid) are excluded by this gate — primarily
the Cascade Range, the Olympics, and the Okanogan Highlands. Passing cells are scored 0–1
proportional to their flat fraction.
Flatness explains the desert clustering
The Columbia Plateau — where Quincy, the Tri-Cities, and all four proposed campuses sit —
is a basalt plateau formed by successive lava flows. Wallula Gap and Richland score
1.000 flatness (fully flat cells). Quincy scores 0.769. In contrast, the Malaga /
East Wenatchee cluster scores only 0.479 — it sits at the Columbia River canyon where the
Cascades descend to the plateau, introducing enough relief to reduce the buildable flat fraction
meaningfully. Developers who cite “proximity to power” as the reason for eastern WA
concentration are correct, but terrain is an equally silent co-factor: the basalt plateau requires
minimal site preparation on campuses measuring hundreds of acres.
The Tukwila corridor (HorizonIQ, ColoCrossing) scores 0.828 on flatness — the Duwamish
industrial valley is engineered flat — but carries the lowest community burden score
(EJ = 0.109) of any active cluster. The flatness gate removes the Cascade foothills cells
that had been artificially inflated by strong transmission and water scores.
Fraction of each 5 km cell with slope < 5° (SRTM1 ~90m). Dark cells are hard-gated as
unbuildable (< 3% flat area). YlGn scale: 0 = scarce flat land / 1 = highly flat.
White filled = existing DC; outline = proposed.
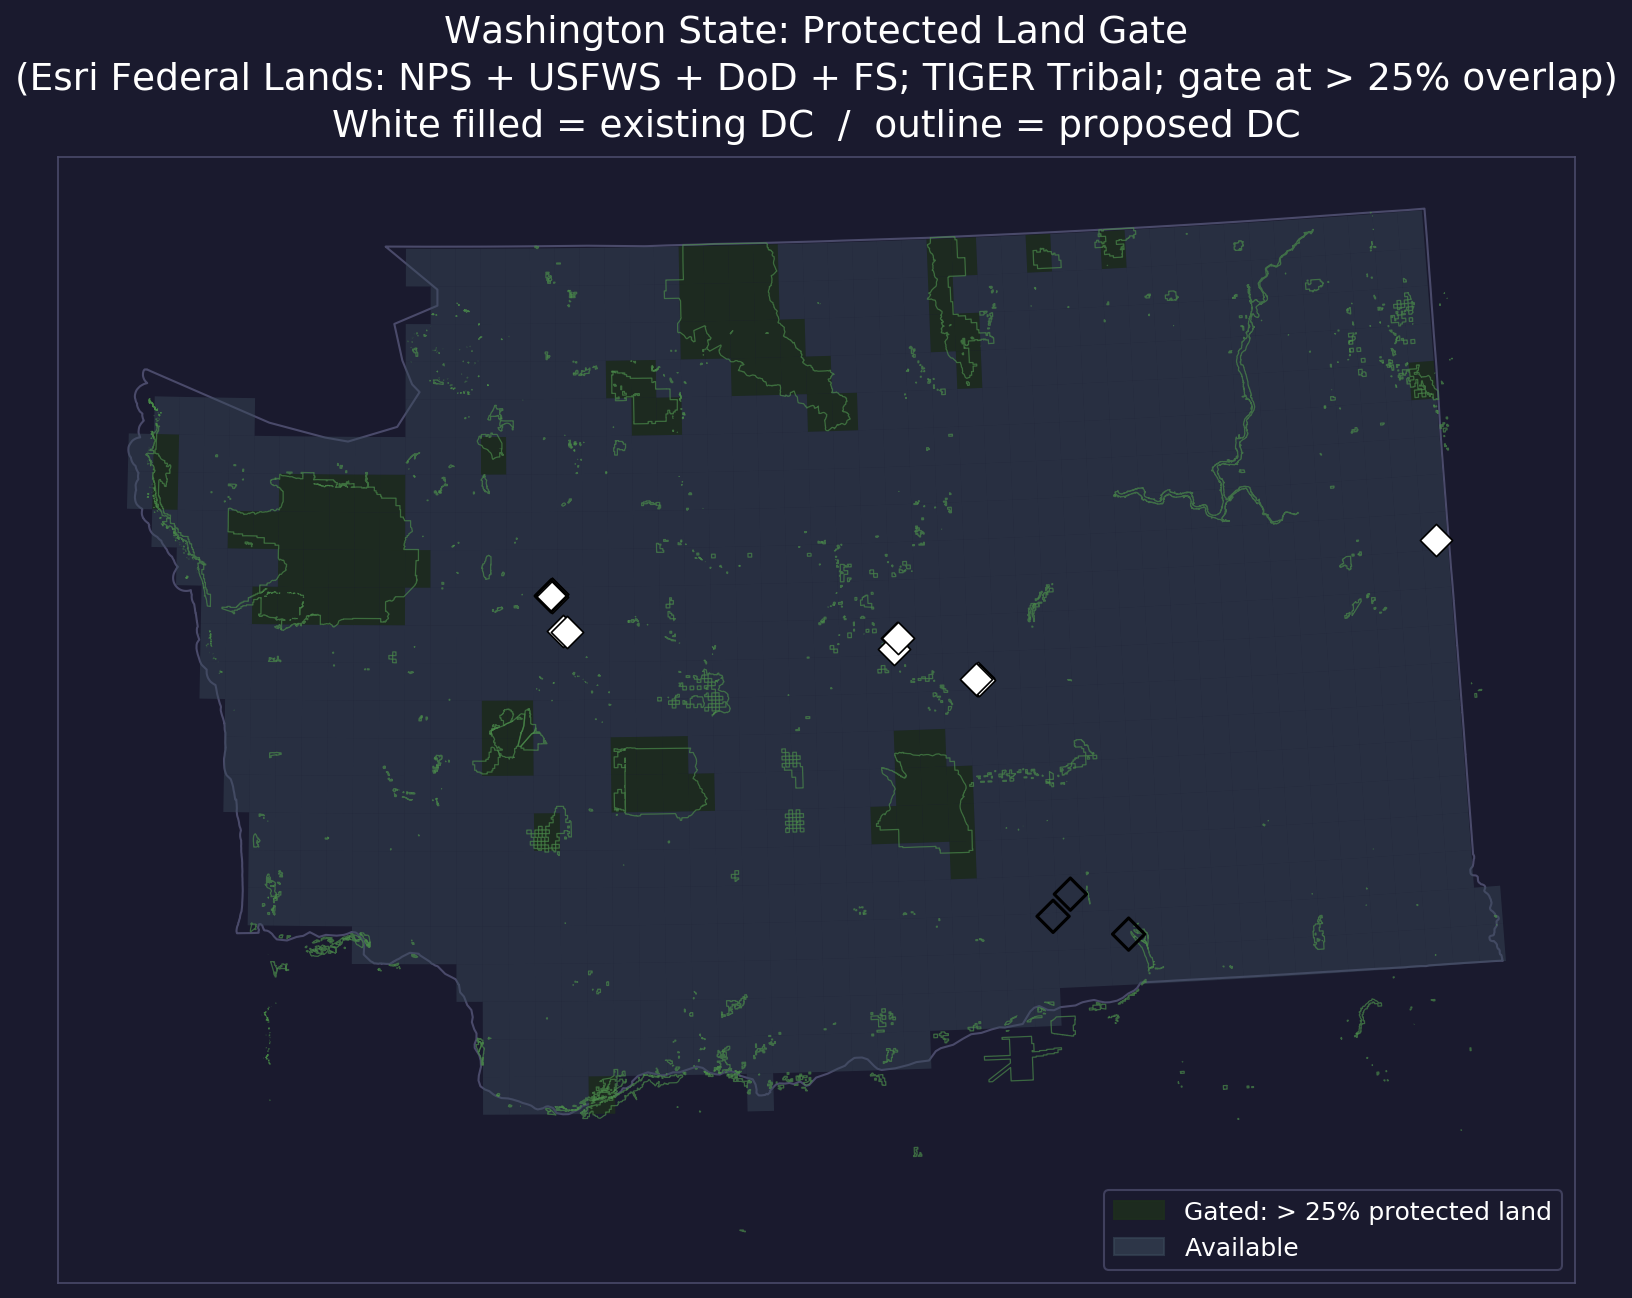
Protected and Off-Limits Land: A Regulatory Buildability Gate
Siting a data center on land that is legally off-limits is not a planning error — it is a
category error. National Parks, Wilderness Areas, Wildlife Refuges, military installations, and
American Indian sovereign territories are not difficult to permit; they are impossible to permit.
This indicator identifies and hard-gates those cells from the analysis.
Protection layer sources: Esri USA Federal Lands (ArcGIS Living Atlas),
filtered to National Park Service, Fish and Wildlife Service, Department of Defense, and
Forest Service units. Bureau of Land Management is excluded because BLM land is leasable
for commercial use. Tribal sovereign territory is sourced from
Census TIGER AIANNH (federally recognized American Indian and Alaska Native
homelands). Both layers are merged and dissolved before computing overlap.
The gate threshold is 25%: a grid cell where more than one quarter of its 5 km extent falls
within protected boundaries is excluded. The reasoning is practical — a cell that is
majority-adjacent to a National Park boundary faces the same permitting exposure, utility
corridor constraints, and community opposition as one that sits directly inside it.
82 cells (8.4% of the analysis grid) are excluded by this gate.
What the gate removes
The gate removes the entire Olympic Peninsula, the North Cascades, the southern Cascades south
of Rainier, much of the Okanogan Highlands (Colville National Forest), and cells intersecting
the Yakama Nation and Colville Reservation boundaries in central WA. Eastern WA agricultural
land, the Puget Sound lowlands, and the Columbia Basin — where existing data center
clusters operate — are largely unaffected. All nine existing and proposed cluster cells
pass with protected fractions well below the 25% threshold.
Combined with the terrain flatness gate (61 cells excluded), the two buildability filters
together remove 124 cells (12.7%) from the viable candidate pool, leaving
850 cells (87.3%) open to composite scoring.
Cells gated by protected land coverage (dark, 82 cells). Green boundary = merged protection
layer (Esri Federal Lands: NPS, USFWS, DoD, FS; plus Census TIGER tribal areas).
White filled = existing DC; outline = proposed.
Methodology
Analysis grid: 0.15-degree fishnet (~14 km cells) clipped to Washington State boundary.
974 cells total. Two hard buildability gates (terrain flatness, protected land) remove
124 cells, leaving 850 viable candidates for composite scoring.
All scores normalized 0–1 before weighting.
Transmission proximity
Distance from each cell centroid to nearest high-voltage (≥100 kV) transmission
line. Lines sourced from
OpenStreetMap Overpass API
(power=line, voltage filter). Distances computed in UTM Zone 10N.
Score = 1 − (dist / max_dist).
Water availability
30-year mean annual precipitation (1991–2020) from
Open-Meteo Historical Weather API
(ERA5 reanalysis). Sampled at 50 interior points, IDW-interpolated to analysis grid.
Score = normalized percentile rank.
Community burden
Demographic Index (average of poverty rate and minority rate) computed from
US Census ACS 5-Year Estimates 2022
(variables B17001, B02001), replicating the
EPA EJScreen Demographic Index
formula. Tract boundaries from Census TIGER/Line 2022. Score = 1 − normalized index
(inverted: lower burden = higher score).
Seismic safety
Peak Ground Acceleration (PGAM) at 2% probability of exceedance in 50 years,
from the
USGS ASCE 7-22 design values API
(2018 National Seismic Hazard Model, site class C). Sampled at 50 points, IDW-interpolated.
Score = 1 − normalized PGAM.
Flood safety
Special Flood Hazard Area (SFHA) designation from the
FEMA National Flood Hazard Layer REST API
(zones A, AE, AH, AO, AR, A99, VE, V). Queried in 40 tiles covering WA; some coastal
tiles unavailable due to service limits. Score = 1 if cell centroid outside SFHA, 0 if within.
Contamination proximity
Distance from each cell centroid to the nearest facility in the
EPA Toxics Release Inventory (TRI),
sourced via the
Envirofacts REST API
(TRI_FACILITY/STATE_ABBR/{state}). 556 geocoded WA facilities (of 1,010 total)
report toxic chemical releases across manufacturing, agriculture, and energy sectors.
TRI provides broader coverage than the NPL Superfund list — it captures industrial
contamination risk at all active facilities, not just the worst ~1% that reach NPL status.
Score = normalized distance (0 = adjacent to TRI facility, 1 = farthest cell in state).
Waterway sensitivity
Distance from each cell centroid to the nearest sample point along a major regulated
Washington waterway: Columbia River (20 pts), Snake River (5 pts), Spokane River (4 pts),
Skagit River (6 pts), Yakima River (4 pts). Proximity is a proxy for
ESA Section 7
thermal discharge constraints and water withdrawal regulatory scrutiny under
Endangered Species Act salmon protections. Score = normalized distance
(0 = adjacent to major river, 1 = farthest cell in state).
Geothermal opportunity
Surface heat flow (mW/m²) from the
IHFC Global Heat Flow Database 2024
(Lucazeau et al., DOI 10.5880/fidgeo.2024.014).
664 borehole measurements within the Washington State bounding box are IDW-interpolated
(k=8 neighbors, power=2) to each grid cell centroid using EPSG:32610 metric coordinates.
Raw values are capped at the 95th percentile (162 mW/m²) before interpolation to
prevent hydrothermal anomalies near Mount Baker (up to 5,146 mW/m²) from dominating.
Score = interpolated heat flow / maximum interpolated value
(0 = low geothermal potential, 1 = high).
Terrain flatness
Slope computed at ~90m resolution from
SRTM1 tiles
(AWS Open Data terrain tiles bucket; 36 tiles covering WA bounding box).
Raw HGT binary files parsed with NumPy; slope derived via numpy.gradient
with per-latitude correction for east–west pixel width
(dx = RES × cos(lat) × 111,320 m/deg).
For each grid cell, flat_frac = fraction of ~90m pixels with slope < 5°.
Hard gate: cells with flat_frac < 0.03 (< ~185 acres of sub-5° terrain)
receive flatness_score = 0.0 and are excluded from composite scoring entirely.
Passing cells: score = flat_frac / p95(flat_frac of buildable cells), clipped to [0, 1].
Population exposure
Tract-level total population from the
American Community Survey
5-year estimates (table B01003), divided by tract area (km²) to produce population density.
Each grid cell is assigned the mean density of all census tracts whose centroid falls within it.
Density is capped at the 95th percentile to reduce outlier influence from dense urban cores,
then inverted and normalized to [0, 1]: 1 = low density (few residents exposed),
0 = high density (many residents nearby).
This layer is orthogonal to Community Burden (EJ): EJ measures who lives nearby (poverty and
minority share); Population Exposure measures how many.
Protected land
Protected area boundaries from two sources:
(1) Esri USA Federal Lands (ArcGIS Living Atlas public service),
filtered to four agencies: National Park Service, Fish and Wildlife Service,
Department of Defense, and Forest Service. BLM excluded (leasable for commercial use).
(2) Census TIGER AIANNH
(federally recognized American Indian and Alaska Native homelands).
All sources reprojected to UTM Zone 10N (EPSG:32610), dissolved into a single multipolygon,
and intersected with each grid cell using geopandas.overlay(how='intersection').
protected_frac = intersected area / cell area.
Hard gate: cells with protected_frac > 0.25 receive protected_score = 0.0
and are excluded from composite scoring entirely.